1000 timers in Jmeter, which one should I use it ? Precise.. Constant..

Sorry for the clickbait — there aren’t actually 1000 timers in JMeter. But I can assure you that many QA engineers and developers might get confused between these two timers: Precise Throughput Timer and Constant Throughput Timer.
There are plenty of articles and tutorials about what Jmeter timers are. Even though JMeter offers a dozen different timers, I’ve found very few resources that explain when to use each timer in real-world scenarios.
Surprisingly , I have not seeing enough article explaining it, most of them were explaining what the timer is and rarely using that on testing an api endpoint. I believe knowing how to choose the right timer, so to accommodate your test objective is what matters the most.
Before diving into Constant Throughput timer and Precise Throughput timer, I want you to get a quick glance on what the Jmeter User manual about timer here : Jmeter Official Documentation
However, the official documentation is quite limited, and there’s not much detailed information available online.
After multiple rounds of trial and error, I decided to write this article to share what I’ve learned from one of the projects I’m most proud of. (It was my first real experience with non-functional testing, and I learned a ton from it!)
Lets get straight to the topic, I will start off with a case here, there is this api endpoint that returning crypto prices, and tech team want to further reduce the cache TTL (Time to live) from 60s to 30s.
What happens next?
Reducing the cache duration means the server will receive 2x the throughput, since cached responses expire faster, and more requests will hit the backend.
Do we need a performance test?
Yes. We need to ensure the server can handle the increased load without degrading performance or crashing.
How should we design the performance test?
The goal is to verify the server can handle the increased throughput — or identify the breaking point.
Let’s assume the current production traffic is:
- 500 requests per minute with a 60-second cache TTL.
- Each user sends 100 requests per minute.
For the test scenario:
- We’ll simulate 10 users hitting the endpoint.
- Each user will send 100 requests per minute.
- Total: 10 users × 100 requests = 1,000 requests per minute — 2x the current production load.
This setup mirrors the expected traffic increase after reducing the cache TTL and helps us assess server performance under the new conditions.
In this scenario, how would you perform the test?
We know that we will have to :
- 10 users
- Sending 1k request per minute
- Set the test duration (eg: 3 mins)
- Set the test metrics (Average response time, error rate, total requests, etc)
- Choose the test visualisation method(View tree results, Aggregated report and etc)
ps: I will only focus on the first 3 steps to explain the use case in this article.
To set this up in Jmeter, it will bring us to the next question, how do we ensure that the users are sending requests gradually, instead of sending 1000 requests at the 1st second of the test?
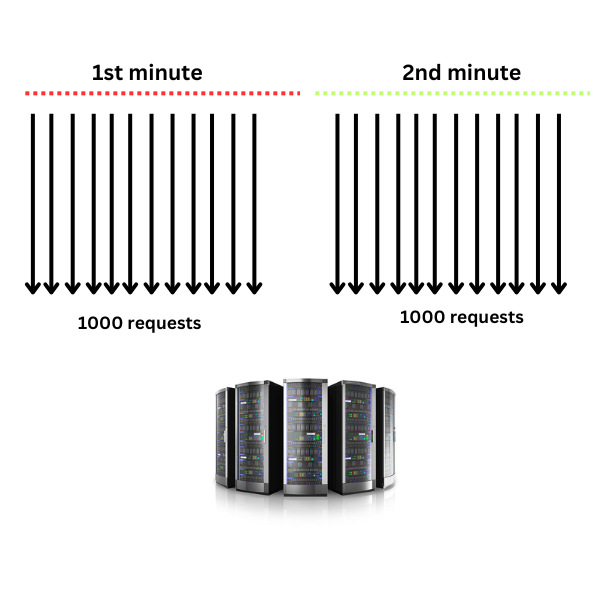
Arguably, we can also have 1000 users and sending 1 request at the first second, but that’s not the ideal way to this situation. It will be sending 1000 requests at the 1st second of the 1st minute of the test, and followed by another 1000 requests at the 1st second of the 2nd minute…

However, in order to achieve our test objective, we will need 1000 requests per minute, which looks like this.
To achieve this, we knew that we need to either
- To control the time interval between the each request, or:-
- To control the number of requests being sent out within that period of time.
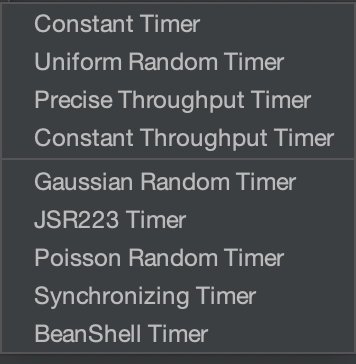
Let’s look at how each of them look like in Jmeter,

They both looks similar isnt it ? Constant and Precise , what does it means?
At first glance by reading the fields in the timer, both of them looks very similar and can achieve the same goals.
Let me explain both of them to you,
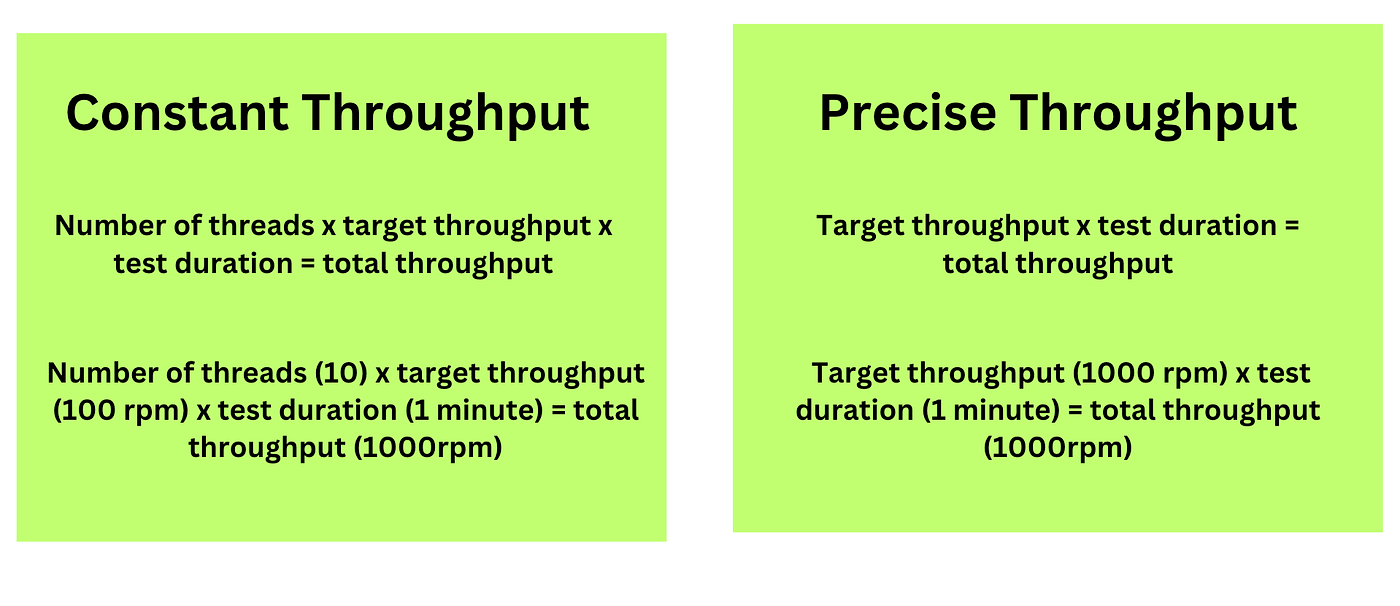
🎯 Precise Throughput Timer
- Goal: Achieve the target throughput as accurately as possible, distributing requests at precise intervals.
- Precision: More accurate, especially at lower throughput levels.
- Mechanism: It calculates the exact delay needed between requests to hit the target rate.
- Use Case: When you need very consistent, evenly spaced requests (e.g., monitoring cache expiry or testing APIs with strict rate limits).
🔧 Example: You set 60 requests per minute → It sends exactly 1 request every second.
⚡ Constant Throughput Timer
- Goal: Maintain an approximate throughput over time, but with less precision.
- Precision: Can fluctuate slightly, especially for low request rates or in distributed testing.
- Mechanism: It adjusts the delay after requests are sent, so the throughput may vary slightly.
- Use Case: When you care about maintaining an average request rate over time rather than exact timing.
🔧 Example: You set 60 requests per minute → It aims for 1 request/second, but actual timing may vary.

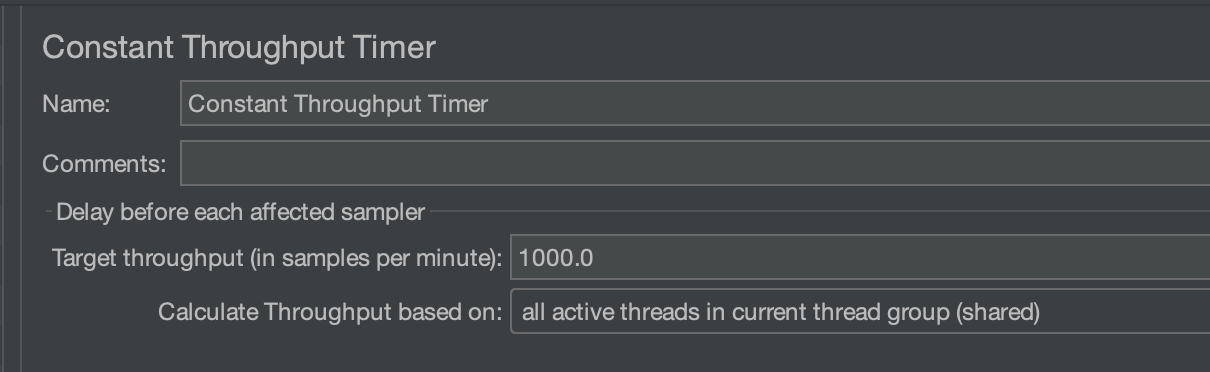
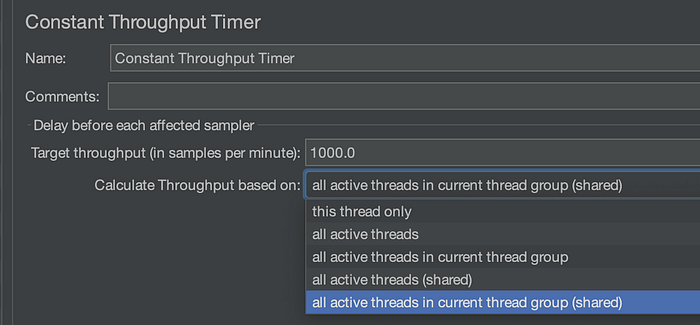
1. Now let’s implement Constant Throughput Timer,
- 10 users/threads
- 60 seconds test duration
- 1000 target throughputs per minute
2. Next, let’s implement Precise Throughput Timer,
- 10 users/threads
- 60 seconds / test duration
- 1000 target throughputs per throughput period
- 60s for throughput period

It’s not hard to notice that the rate of increasing the request are slightly different between this two timer.
For Constant Throughput Timer, it is increasing by the multiplier of 10, where the Precise Throughput Timer is increasing at the rate of 20–30 calls per seconds. The question is why ? Can you relate it?
Now let’s twist the users/thread counts for Constant Throughput Timer, and you will notice the secret here. Let’s change the users/threads count to 100, and the rest of the configuration stays the same.

And we did the same to Precise Throughput Timer, we change the users/threads count to 100, the rest of the configuration stays the same.

We are not giving up here ! We want to test if Constant Throughput Timer can do the same, let’s try it one more time.
Now, let’s observe the test,
As you can see the Constant Throughput Timer triggered 100 calls at the first second, then increasing it to 1000 requests per minute, this is because Constant Throughput Timer is very sensitive with the number of the thread users.
We can try again with 1000 users using Constant Throughput Timer.
In summary, we can concluded that Precise Throughput Timer is more appropriate in helping us to achieve the test objective, especially when we want a certain RPM in our test. We can probably achieve the same with Constant Throughput Timer here, but we have to ensure the number of threads are accurate (which in our case, we do not really care about number of users here.)
Hope this helps you to have a better understanding of Constant and Precise Throughput Timer in JMeter. Thank you!
Ensure you follow me on LinkedIn or Medium to get notified about it!
✅ MoreArticles:
- Equivalence Partitioning and Boundary Value Analysis
- “From REST to GraphQL” — Wait, GraphQL? SQL? Are they the same?
- Cloud Computing, let’s talk about it [Part 2]
- AWS! The terms you must know 🤫
- ISTQB 🧙🏻♀️The software testing Myth, do you need that?
- Why is software testing needed in the first place?
- What is Agile Methodology?
- Java 101 for software testing (Using fruits and Vehicle as examples)
- What do you need to know to test using Selenium in Java? (that I wished somebody had told me)
- “Understand what Docker is in 5 minutes: Challenged Accepted”
- Black Box or White Box Testing? (How many boxes do you need ?)
✅ ☎️👇🏻
Or connect with me on LinkedIn to discuss this further!